Much historical commentary emphasizes how pandemics restructure long-standing social and political arrangements. The observation applies to macroeconomics as well.
Support from INET and help from Thomas Ferguson and Özlem Ömer are gratefully acknowledged.
To recap from a previous post (Taylor, 2020): The recently approved $2.2 trillion Coronavirus Aid, Relief, and Economic Security “stimulus” (or better, disaster relief) package amounts to ten percent of GDP. This amount is probably well less than the magnitude of government intervention that ultimately will be required, with implications to be discussed below. But as it stands, the breakdown of CARES spending is already biased away from households and toward non-financial and financial business, viz.
Payments that may flow more or less directly to households – checks in the mail (if they arrive), more unemployment insurance, small business support, state and local government support, and less than $100 billion to food stamps and direct relief – come to $1.2 trillion or 5.7% of GDP.
Big business is set to receive loans and a range of other payments amounting to $800 billion or 3.8% of GDP. A major share, $454 billion, is supposed to back loans to beleaguered firms producing goods and services in the real economy. The package for small business (weirdly defined to include small venture capital firms) is programmed to reach $349 billion. Most of this money will apparently be directed through the financial sector.
Two questions immediately arise: What will be the financial repercussions of the package? What are the longer run fiscal implications of pandemic relief? Here are initial thoughts.
Financial Implications
The $454 billion shows every sign of being another Wall Street scam on the order of the bailout during the Great Recession. It is supposed to undergird loans to business through special purpose vehicles (SPVs) to be spun off from the Federal Reserve’s balance sheet. Similar entities were deployed to resuscitate or take over moribund financial firms during the 2008 crisis. This time they are supposed to generate business loans. Because the Fed is involved, the interventions will be run “confidentially.” Central banks operate behind the scenes for the obvious reason that public announcements about their actions can easily destabilize financial markets.
The plan is to use the $454 billion down payment to provide SPV equity which the Fed can leverage up to $4.54 trillion, presumably to be directed toward firms worth more than $10 billion. (The point of the equity is to absorb possible losses, which is supposed to be a no-go for the Fed.) Big cap corporations occupy the S&P 500 share index, which incidentally includes four national banks and twenty large regionals. The $4.54 trillion is an impressive sum because total corporate debt, mostly built up since the 1980s, is just $6.5 trillion.
The debt came from a fundamental restructuring of corporate finance. Traditionally, corporations tapped profits to pay out two forms of capital income. Households (concentrated in the top one percent) received more or less regular dividends based on their holdings of shares. Interest on debt went mostly to the financial sector and from there flowed through winding channels to households through mutual, insurance, and pension funds.[efn_note]One is reminded of Kubla Khan, “Where Alph, the sacred river, ran Through caverns measureless to man Down to a sunless sea.”[/efn_note]
The pattern changed in the first decade of this century when share buybacks exploded to levels equaling dividends. After a lull during the financial crisis, buybacks by S&P firms shot up to close to a trillion dollars per year. After 2008, non-financial corporate debt rose by $2.8 trillion while S&P firms’ buybacks totaled $5.4 trillion.[efn_note]See Federal Reserve Bank of St. Louis (2020), Yardeni Research (2020).[/efn_note] Evidently, business tapped profits, debt, and recently the proceeds from the Trump tax cut to buy up their own equity.
For business, the advantages include payment flexibility, possible increases in share prices, higher earnings per share, and (perhaps most importantly) supporting levels of executive compensation which are often tied to stock market performance. Upper- income households benefit by paying a low capital gains tax rate. Nowadays, for better or worse, buybacks could only be harnessed by extensive government regulation.[efn_note]The issues are comprehensively reviewed by Lazonick, et. al. (2020).[/efn_note]
Getting back to CARES, the apparent purpose of the SPV loans is to bail out companies from their buyback frenzy. Basically, they would refinance a huge debt-for-equity swap involving business, finance, and the households which ultimately absorbed the debt created by the buybacks. Papering over the obligations run up by corporations is the goal of the endeavor.
Supposedly, only investment-grade debt will be covered but as in the financial crisis means such as cash injections from the Treasury will be found to support firms issuing junk or near-junk bonds. An enduring lesson from the crisis is that if the rating agencies reduce bond grades, then rules which limit SPV purchases can be bent to allow them to proceed. All these transactions will involve fees ranging up to five percent paid to the financial sector for pushing paper.
Another aspect of the rescue is that small business loans will be run through banks, which no doubt will charge fees as well. Along the way, money flows will be supervised by Wall Street firms. Media reporting already suggests cronyism reaching to the White House level in their selection.
On the whole, small and large financial firms will gain a pretty penny.
Fiscal Repercussions
Debt also figures into fiscal impacts of whatever income support arrives for households. The numbers in Taylor (2020) show that government net borrowing from the private sector and the rest of the world might reach 17% of GDP, four percentage points higher than the rate in 2009.[efn_note]The 2009 rate is historical. The rate for 2020 comes from a simple simulation model described in Appendix I here.[/efn_note] The 2020 estimate is based on a ten percent reduction in household consumption. If projections about the dynamics of the epidemic hold true, that loss could well exceed twenty percent. In addition, a two trillion dollar infrastructure package is being discussed. Government borrowing, or the annual increase in debt, could surge above thirty percent of GDP. The current debt to GDP ratio is about 105%. What would be the fiscal and monetary implications?
As described in Appendix II, at the national level, there are basically five ways for governments to deal with debt. The first is running it up for a time, the obvious American strategy, especially since loan repayments to the government will likely reduce the deficit in the future. But there are complications, all involving the Federal Reserve. The Fed has some room to maneuver but its freedom may be limited by its own accumulation of government debt, inflation, and portfolio decisions abroad.
Central banks operate in bond markets. They prefer to deal with short maturity government issues, for example buying to drive their prices up and interest rates down.[efn_note]In one historical exception, in 1942 the Fed agreed to peg the 90-day Treasury bill rate at 3/8 percent to facilitate war finance. Its “independence,” always subject to political pressure, was restored in 1951.[/efn_note] “Quantitative easing” can extend to purchases of long-term government or corporate bonds and even exchange-traded funds. A looming question is whether growth in debt could tie the Fed’s hands. At the moment it holds about 15% of outstanding government paper, meaning that it can undertake transactions against a big stock of bonds in private hands.
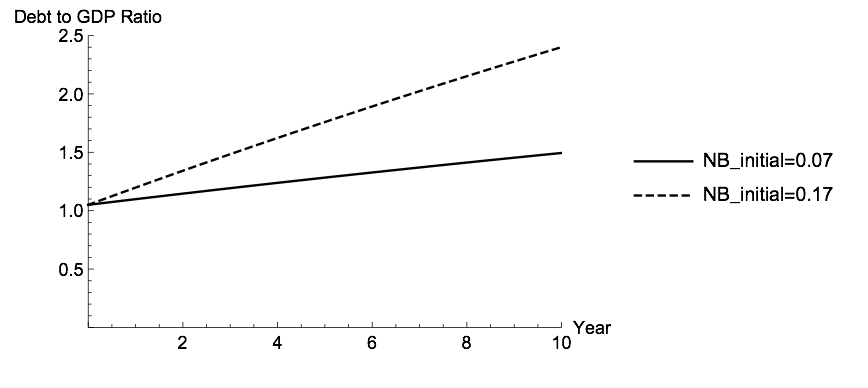
With deficits in the range now being generated, growth in debt is impressive, with Figure 1 showing the US debt to GDP ratio soaring over 200% in just a few years. Japan may be running a relevant test case. As observed in Appendix II, the Bank of Japan now holds one-half of Japanese government bonds. With net borrowing at around six percent of GDP, the supply is increasing rapidly. Suppose that the BOJ wished to raise interest rates. Selling against rapid supply growth could be difficult, meaning that the bank could not raise Japan’s ultra-low rates even if it wanted to. Eventually, that difficulty could arise here.
Inflation is another worry. Most discussion rests on irrelevant monetarist theory. Any ongoing inflation is dynamic, with wages (the main component of costs) and/or scarcity prices feeding into the overall price level, and vice versa. The Fed “creates” money by ratifying credit expansion by banks and other intermediaries. Money is the liability corresponding to bigger bank assets. It will not feed into inflation without other driving forces, notably social conflict over income claims.
In a simple conflicting claims inflation model, there are two groups of competing actors. Business controls price increases while the money wage is subject to bargaining between business and labor. Both sides target the wage share of national income (basically profits plus wages), creating conflict. The crucial observation today is that labor’s bargaining power has been drastically reduced by political intervention over the period spanned by Presidents Reagan and Trump and is now further weakened by the huge rise in unemployment.
In an inflationary environment, business can respond rapidly to push down an increase in the wage share or output by increasing the rate of price increases along the “Inflation” schedule in Figure 2. Money wages, on the other hand, are not immediately indexed to price inflation so that they will follow with a lag.
Labor will push for faster wage inflation when its share is low. A “Stable share” schedule with a negative slope will emerge from this process. There is an initial macro equilibrium at point A, with adjustment of wages toward the stability schedule with a constant share (small arrows).

By stimulating aggregate demand, higher fiscal borrowing would shift the inflation locus upward (dashed line) with more rapid inflation and a lower wage share at B along the initial Stable share curve.
Under wage repression, the ability of workers to attain a high wage share could be curtailed. The stability schedule would shift downward (or to the left). Both inflation and the wage share would fall. There could be a new equilibrium at point C with higher fiscal demand, less inflation, and a lower wage share. Such shifts summarize five decades of social conflict. An additional observation that austerity policies have often been enforced, with further adverse effects on labor.
Under these conditions, a burst of inflation in response to higher government borrowing looks unlikely. A triggering factor could be price increases for key components of consumption which could mobilize wage push. Look out for spiraling costs of health care, already one-quarter of total consumption. Or would supply shortages and health concerns of workers make them more fractious than a simple conflict model would suggest? It remains to be seen.
Somewhat similar considerations apply to a post-disaster rescue external deficit of 2.5% of GDP or $500 billion. Outstanding Treasury debt held abroad is $6.4 trillion. A potential run against the dollar could not change this total by very much because there is no large-scale alternative global asset.
This protection, however, is not invincible. There are financial instruments besides American liabilities available in the world market. A visible portfolio shift against Treasury debt would have to be met in one of two ways (or a combination). If the interest rate is held constant, the exchange rate against the euro, renminbi, yen, or an ounce of gold would have to lose value meaning that American import prices would rise and export prices fall. The import coefficient is only 14%, but if prices of key imported consumer commodities were to jump upward, the impact could provoke inflation (especially if the Stable share schedule in Figure 2 were to shift upward). On the other hand, if the Fed intervened to stabilize the exchange rate, it would have to raise the interest rate to draw in foreign funds, potentially cutting effective demand.
The effects of trade wars are unlikely to be crucial macroeconomically but could have unpredictable effects depending on market psychology. In response to changes in the exchange rate, a shift of ten percent in import or export flow would be improbably large on its own terms. The macro impact would be on the level of the Trump tax cut, not overwhelming in the short run but with longer-term repercussions on net foreign assets.
Finally, global financial economics is a mare’s nest of unpleasant surprises or unknown unknowns if you prefer. One known is that the Fed has long-standing short-term swap agreements with foreign central banks. It recently created a new facility to allow foreign countries (potentially including China) holding stocks of Treasury bonds to exchange them for dollars to obtain liquidity. Meanwhile, if the Europeans do not manage to come up with a mutualized corona bond there could be a run toward the dollar. Another known is that developing economies will certainly need trillions of dollars of support to fight the pandemic, in America’s interest as well as their own. The funding naturally would be created by the International Monetary Fund and World Bank, but the Treasury and Fed would have to sign off.
The bottom line is that if government net borrowing is limited to around 17% of GDP, labor unrest is contained, and CARES lending is repaid promptly, then fiscal and monetary balances are not immediately threatened but dangers could mount in not very many years. If the macroeconomic rescue package increases from ten to a level closer to twenty percent of GDP – as well could be the case given current projections of the course of the pandemic – then all bets are off.
Much historical commentary emphasizes how pandemics restructure long-standing social and political arrangements. The observation applies to macroeconomics as well.
Appendix I: Back of the envelope net borrowing model
The calculating scheme used in Taylor (2020) to make net borrowing projections simply scales four annual leakage flows (for saving by households and business, government taxes minus transfers, and imports from the rest of the world) to total output. Four annual injection flows (investment by households and business, current spending plus investment for government, and exports) are set exogenously. Each year’s “multiplier” is the inverse of the sum of the four leakage rates. The multiplier times the sum of injections equals annual output. Each net borrowing rate follows as an injection divided by output minus the corresponding leakage rate. The sum of net borrowing rates equals zero. Net borrowing levels are rates times output. In Taylor (2020), Figure 1 shows annual net borrowing rates in the form of a bar chart. Algebra for a three-sector version consolidating households and business appears in Taylor (2019).
Appendix II: Dealing with fiscal debt
One way is to continue to run debt up. Present-day levels of debt to GDP ratios are around 100% in the USA, France, and (even) Italy, ranging up to 250% in Japan. Maybe five percent of French and Italian debt is held abroad. Befitting the dollar’s role as the key international reserve currency, one-third of US government debt is in foreign hands. Japan holds foreign reserves equal to one-quarter of GDP. On the other hand, the Bank of Japan holds about one-half of outstanding Japanese government bonds (up from less than ten percent in 2011).
A second option is to increase taxes or reduce fiscal transfers and/or government purchases of goods and services to reduce the net borrowing to GDP ratio. A standard “Domar rule” (Taylor, 2019) states that the debt ratio will not explode over time if the output growth rate exceeds the real interest rate. Recently, the output growth rate has been in the vicinity of 2.5%. The real medium-term borrowing rate on Treasury securities is around 0.5% so the condition is satisfied. The debt ratio’s growth toward a steady- state will be faster, the greater the net borrowing ratio to GDP. With government net borrowing at seven percent of GDP, the steady-state debt ratio would be 350%. At seventeen percent it would be 850%. Figure 1 illustrates the near-term trajectories.
Third, a country can refinance its debt by borrowing from foreign sources, an option often forced upon developing or peripheral European countries, accompanied by stiff austerity “conditionality” packages imposed by lenders. (As discussed above, the lack of conditionality imposed on big business by the CARES package is striking.)
Fourth, debt can be repudiated or defaulted. Creditors tend to disapprove and can impose sanctions. Loss of reputation follows, tending to be forgotten over time.
A final option, not widely pursued in recent decades, is to run an inflation with interest and exchange rate controls, to reduce the real value of the debt.
Lance Taylor is Arnhold Professor of International Cooperation and Development at The New School for Social Research.
This article was originally published by INET. You may find it here.
References
Federal Reserve Bank of St. Louis (FRED, 2020) https://fred.stlouisfed.org/series/NCBDBIQ027S
Lazonick, William, et. al. (2020) “4 Ways to Eradicate the Corporate Disease That is Worsening the Covid-19 Epidemic,” https://www.ineteconomics.org/perspectives/blog/4-ways-to-eradicate-the-corporate-disease-that-is-worsening-the-covid-19-pandemic
Taylor, Lance (2019) “Macroeconomic Stimulus à la MMT,” https://www.ineteconomics.org/perspectives/blog/macroeconomic-stimulus-%C3%A0-la-mmt
Taylor, Lance (2020) “Covid-19 Hits the Dual Economy: Incomes Destroyed at the Bottom, Profits Supported at the Top,” https://www.ineteconomics.org/perspectives/blog/covid-19-hits-the-dual-economy
Yardeni Research Inc. (2020) “Corporate Finance Briefing: S&P 500 Buybacks & Dividends.” https://www.yardeni.com/pub/buybackdiv.pdf