This essay was originally published on July 5 2019.
The year was 1875 and Carrol Wright was upset. The mustached state senator from Massachusetts thought that American workers had a problem. Just not the problem that the workers thought they had.
Following the financial Panic of 1873 and nosediving wages, Americans were launching wildcat strikes, torching railroad stations, and fighting bloody battles with federal and state militias. Historians would later dub the era the “Long Depression,” but Wright had a different diagnosis in the moment: “industrial hypochondria.”
When appointed Chief of the Massachusetts Bureau of Labor, Wright sought to prove his point with cold, hard facts. He calculated the first official unemployment rate in 1878, counting only men over age 18 that an official state assessor determined “really want employment.”
Wright found (surprise!) what he intuited all along: most of the jobless “would not work if they could,” and the number of truly unemployed was quite small. “Courage, patience, and faith in hard work,” he wrote in his official report following the study, “will reward the worker in the near future with continued occupation.”
And so was born our country’s most trusted economic metric.
The unemployment rate is not a fact. It is a political artifact. Since its inception, it has been shot through with biases of all sorts, producing distorted images of American labor. While the biases in today’s labor accounting are less obvious than in past eras, the effect is the same: they warp our collective understanding of the American work experience.
Beyond its birth, two moments — the great depression and the post-2008 era — show some of the many ways that the unemployment rate continues to confuse us.
Counting Slavery by Another Name
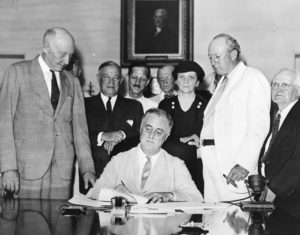
When Franklin Delano Roosevelt scanned the nation from the Oval Office in 1933, things looked pretty grim. The plight of the industrial worker in the Midwest and Northeast, in particular, drew his attention as the regions recorded record-high unemployment.
But while labor statistics cried for help in Michigan, they were silent about Mississippi.
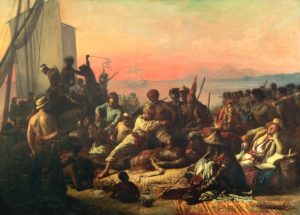
Labor in South in the 1930s was dominated by tenant and sharecropping production. Fully half the rural population – some 8.5 million farmers – labored under some sort of “furnishing” system: landlords provided “croppers” everything they needed for cotton production – draft animals, housing, even food – in return for a statutory lien on their harvest. At the end of cotton season, the disproportionately Black croppers found themselves in the red on their creditor’s books and were forced into another year of indebted labor. Historian Douglas A. Blackmon called this system “slavery by another name.”
How did this “slavery by another name” show up on the spreadsheets of Department of Labor bureaucrats? As a very small number.
The unemployment rate in Cotton Belt states in the 1930s was regularly a third what it was in the Northeast. Mississippi, a state with some of the highest rates of tenancy and cropping, recorded the nations’ second lowest unemployment rate of 4.8 percent in 1937. All of those sharecroppers were, after all, “employed.”
This selective vision was rooted in the racial politics of the moment. FDR’s New Deal administration was practicing a studied non-observance of southern, rural, and black poverty throughout the 1930s, its attention focused on what it considered the proper proletariat.
Why include farm and domestic workers in historic labor and social legislation? The numbers said they were doing just fine.
Unemployment in the post-2008 world
Today’s statistics have been scrubbed of much of the obvious racism and political biases of history. The Current Population Survey (CPS), the Labor Department’s monthly phone survey that produces the unemployment rate, is an exemplar of high-tech research, employing advanced sampling methods and rigorous regression analyses. And yet it continues to miss the mark.
Labor conditions have changed so much in recent years that the employed/unemployed binary often obscures more than it reveals about workers’ wellbeing.
Under the current CPS rubric, anyone who has done any work for any pay in the week prior to being surveyed is considered employed. This may have been an understandable short-hand in the 1960s when work for pay likely meant some job stability, a “family wage,” and a pension.
Not so today. As the W2 is edged out by the 1099, “employment” increasingly means an endless, insecure hustle. But official statistics don’t see this. Made $45 driving for Lyft last Tuesday? You’re employed! One shift as a barback? You’ve got a job! Social Media Interning for a stipend? Success!
Take, for example, how the unemployment rate understands 64-year-old Michael Matthews* in Austin, Texas. Michael was pushed out of a twenty-two-year career at IBM in 1999 when the company restructured its pension program. He bounced between short-term gigs for a decade before striking out on his own — buying an LLC license and launching his own “career coaching” company offering job search advice to unemployed professionals.
It isn’t paying the bills. Unable to afford health insurance in the U.S., Michael is in the process of moving to Mexico.
From the window of the Department of Labor, Michael looks like a shining success (on LinkedIn, too, where his title is “Founder and CEO”). But the numbers do no justice to his situation — the aging CEO can’t even afford an American hospital.
We don’t just need leaner and meaner official labor statistics. Yes, we should use metrics that more accurately reflect the dynamics working people face: figure out how to account for the rise of gig, contract, and freelance work; raise the profile of other statistics like the relationship between wages and housing expenses or labor’s share of profits; put numbers to the invisible work that women and immigrant workers so often do.
But we need more than this. Labor statistics are not objective mirrors for self-examination. They are tools. As we use these tools, we need to be constantly reflective about how they were made, who and what they see and don’t see, and who ultimately benefits from their construction as such.
Today’s Department of Labor celebrates Carrol Wright, pioneer of the unemployment rate, for his “objective judgments and impartiality” and his “fearless publication of the facts.”
These are facts we ought to double-check.
Patrick Sheehan is a writer and graduate student at the University of Texas at Austin. His writing has appeared in Jacobin Magazine, In These Times, AlterNet and Occupy.
Sources:
On Wright and first unemployment rate: Garraty, John A., (1978). Unemployment in History: Economic Thought and Public Policy. Harper & Row, 108-109; and DOL history on Wright.
On sharecropping: Blackmon, D. A. (2008). Slavery by another name: The re-enslavement of Black people in America from the Civil War to World War II . New York: Doubleday. How the Current Population Survey measures unemployment.