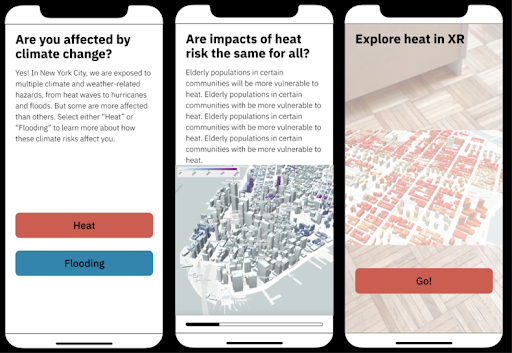
Image credit: Ocellus XR
In 2005 Roger Mougalas popularized the term “Big Data,” referring to data sets that were so large they were nearly impossible to manage with conventional processing tools. Although the challenge of data management was not necessarily new at the time, this represented a key turning point in how we share and depict data, especially when it comes to complex issues such as climate change or urbanization. Today, many of our contemporary social and ecological challenges are so multifaceted that the solutions needed to address them often require the analysis of big data and use of computational resources unavailable to most people and city officials.
Even in large urban centers such as New York City, many communities lack access to urgently needed information about the potential impacts and risks of climate change or lack specialized expertise to translate this information into something meaningful. In the case where resources are available (eg. the City’s Open Data portal), there are still massive gaps in both the available data and in formats that are intuitive to interpret that makes it difficult to understand future risk to inform planning and preparedness.
New technologies such as augmented reality and data visualization tools have emerged over the past decade offering new ways for audiences to not only view and understand big data, but to also interact with it. Yet the majority of these technologies continue to be expensive, privatized, or often exclude the communities who are likely to benefit from these tools. As a result, there are few ways for the public to understand where, how, and when vulnerable populations are exposed to climate-related hazards like heat waves, coastal flooding, or inland flooding. Further complicating this, urban planners and architects often lack adequate tools for creating participatory processes to inform decision-making, highlighting key environmental justice concerns that impact how communities equitably plan for climate adaptation.
In 2019, members of the Urban Systems Lab (USL), including Joe Steele, Xinyue Elena Peng, and Claudia Tomateo, launched the Ocellus XR project to address some of these issues. The project takes its name from the Latin ocelli (plural ocellus), which translates to “simple eye,” and is known in zoology as simple photoreceptors used by insects, such as bees, to detect movement.
Drawing inspiration from this root meaning “to see change,” the idea for Ocellus XR was to extend the Lab’s data visualization platform (originally formatted for a desktop) into an integrated and mobile-friendly portal to host social, ecological, and technological data using location-based and extended reality features (XR). Led by USL Associate Director Daniel Sauter and Director Timon McPhearson, Ocellus XR aims to provide an open source and easy-to-use mobile app that democratizes access to climate data in New York City and supports more inclusive decision-making.
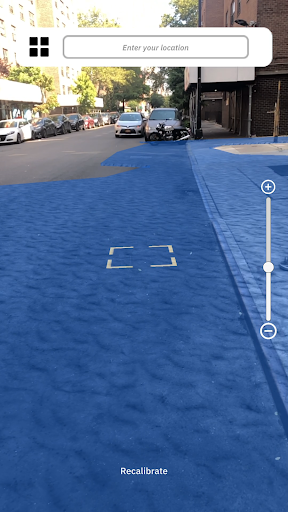
What do we mean by “extended reality”? Extended reality (XR) is an umbrella term for immersive technologies such as virtual reality, augmented reality, and mixed reality. Ocellus XR primarily uses augmented reality, allowing users to not only view interactive maps of climate risks such as flooding or extreme heat, but to also experience first-person 3D visualizations of climate risk, social vulnerability, and proposed green infrastructure plans all on your phone or mobile device. As you traverse the streets of New York City you can view climate risk and other data in real-time through an immersive augmented reality experience.
When a user first opens Ocellus XR, they are presented with an easy-to-follow narrative focused on urban flooding or heat. Depending on which indicator the user chooses, the app provides information on current and future climate risks, as well as solutions the city is actively engaged in, such as the creation of rain gardens and bioswales, green roofs, stormwater management, and nature-based shoreline protection. After swiping through these initial screens, users can discover 3D spatial data live at street levels (such as flood projections, future heat risk, and the location of cooling centers), green infrastructure and demographic datasets, and can visit remote locations across the five boroughs.
The majority of the app’s data draws largely from publicly available repositories such as the NYC Open Data portal, US Census Bureau, the American Community Survey, FEMA, and NASA among others. This includes information on climate hazards (current and future heat and coastal flood exposure), social vulnerability (such as age, income below the poverty line, and race/ethnicity.), critical infrastructure vulnerability (including hospitals, schools, and NYCHA properties), and nature-based solutions (street trees, bioswales, green roofs).
The design of Ocellus XR builds on popular theories of spatial representation developed by David Harvey, who articulated three ways of understanding perspective and context for users: absolute (static), relative (context-dependent), and relational (dynamic and interactive). Ocellus utilizes all three of these perspectives, allowing for dynamic spatial representations and user-generated inputs that can render graphic outputs based on user interactions.
This allows the user to go beyond a reliance on static GIS maps and harnesses the principles of cinematography and motion graphics to tell stories for different audiences and purposes. The use of interactive 3D maps similarly provides the freedom for users to seamlessly explore and compare data at local, regional, national, and global scales. (For a complete description of the application stack for the Ocellus desktop version, see “Visualizing Urban Social–Ecological–Technological Systems” by Daniel Sauter, Jaskirat Randhawa, Claudia Tomateo, and Timon McPhearson in Resilient Urban Futures.)
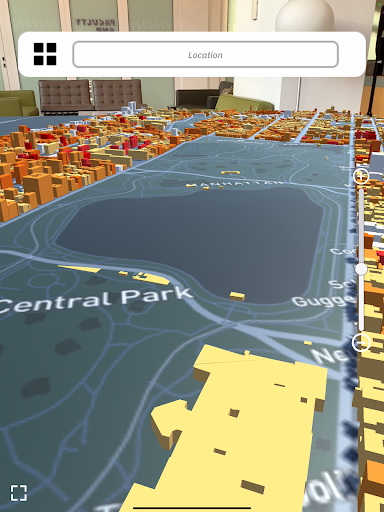
Most importantly, Ocellus XR is a tool for catalyzing participatory planning processes. With the app users can project 3D maps onto physical surfaces such as a wall or table, providing the capability for researchers and local community stakeholders to easily view multiple data sets and information on an interactive map and better understand how vulnerable populations are exposed to climate hazards. In this, Ocellus aims to address a frequent issue that we hear often from our partners on the ground—that they are excluded from decision-making and lack access to high-resolution data needed to advocate for equitable climate action.
In creating a common space to engage in conversation, Ocellus XR may increase the speed of interventions, scenario testing, and co-visioning of solutions that center the voices of frontline communities.
The team recently received an Architecture + Design Independent Project award from the Architecture League of New York to finalize a beta version of Ocellus XR. We hope it will be available for download soon. In the meantime, you can visit our project page to learn more, and if you’re interested in being a tester or joining us in launching the app, please get in touch!
Daniel Sauter is an associate professor at Parsons School of Design, director of the (MS) Data Visualization program, and associate director at the Urban Systems Lab. Daniel Sauter is the lead designer and director of the Climate Equity XR project. He will oversee the development of the XR app, user testing process and Hub launch.
Timon McPhearson is director of the Urban Systems Lab, professor of urban ecology at The New School’s Environmental Studies Program, and research faculty at the Tishman Environment and Design Center.
Christopher Kennedy is the associate director at the Urban Systems Lab at The New School and lecturer in the Parsons School of Design.